Embedding Trust
Semantic Isotropy Predicts Nonfactuality in Long-Form Text Generation
This post accompanies our ICML 2026 paper Embedding Trust: Semantic Isotropy Predicts Nonfactuality in Long-Form Text Generation. It explains, in plain terms, why the angular spread of text embeddings reliably indicates when a language model is fabricating.
Introduction
Large language models now serve as front-line knowledge workers, and deploying them in medicine, law, policy, or science demands a way to judge when to trust a response. Short multiple-choice outputs have well-studied calibration tools. Long-form open-ended outputs do not. Paragraphs, biographies, and summaries hide facts inside implicit claims; a single response can be partly right in ways that resist automatic scoring.
Most existing approaches to long-form factuality rely on claim-by-claim fact-checking: decompose the response into atomic statements, retrieve evidence for each, and aggregate. This costs many LLM calls per response, compounds errors, and breaks down at scale.
We ask a simpler question:
In our paper, we show that it can. The quantity we propose, the semantic isotropy score — the angular dispersion of normalized response embeddings on the unit sphere — predicts nonfactuality, often beating state-of-the-art uncertainty quantification methods by a wide margin.
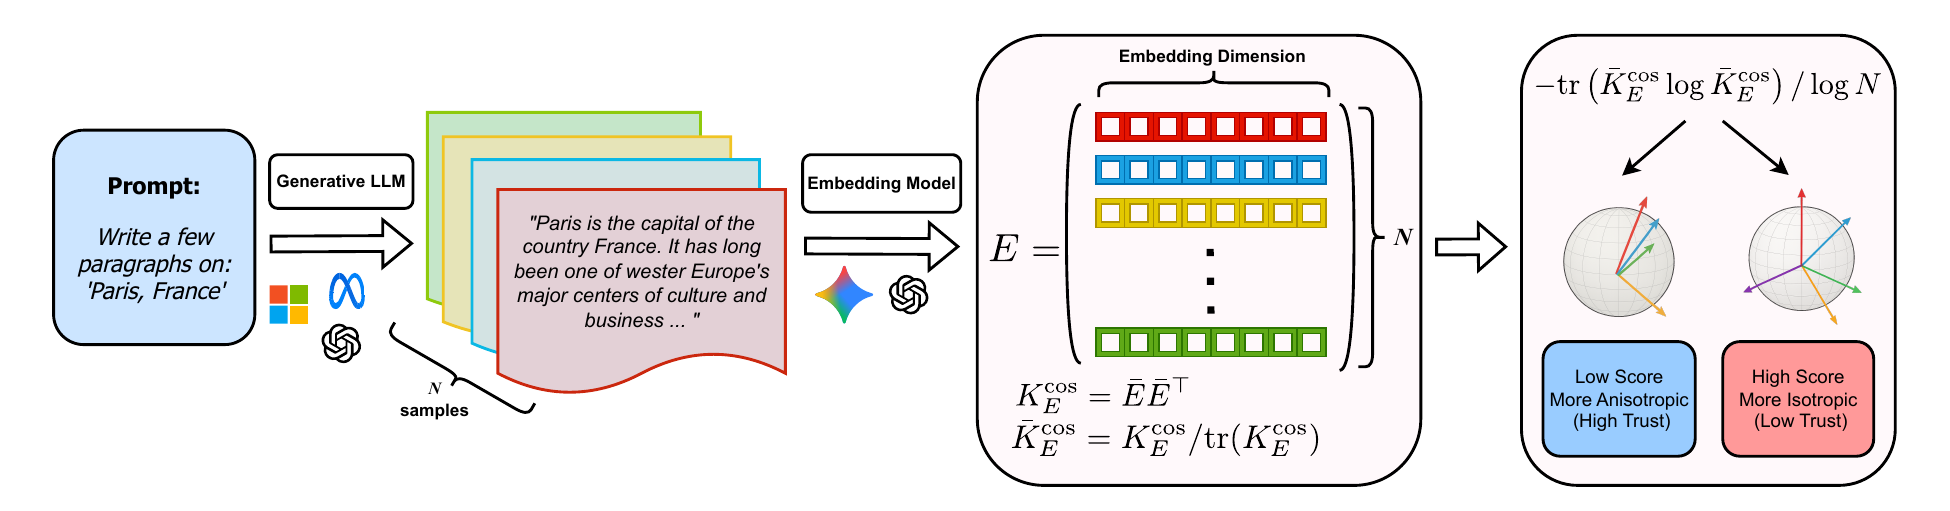
Figure 1 traces the pipeline end to end. Each prompt feeds the generator \(N\) times to produce a small bag of responses; the embedding model lifts each response into a vector on the unit sphere; the cosine kernel records every pairwise angle in a single \(N \times N\) matrix; and the von Neumann entropy of that kernel collapses the geometry into one number. Every step uses off-the-shelf components, and the chain of operations is short enough to run in seconds for the sample sizes we care about.
Why Long-Form Factuality is Hard
Uncertainty signals that work on short answers fail on long ones:
- Token-level perplexity and length-normalized entropy weight every token equally; a 500-word biography drowns the signal in function words.
- Semantic entropy and other NLI-clustering methods scale quadratically in the number of responses and depend on entailment models whose context windows rarely fit long passages.
- Internal-state probes such as EigenScore tie the score to one generating model and weaken as responses grow longer.
- Claim-extraction methods — FactScore, LUQ-Atomic, SAFE, VeriScore — decompose a response into atomic claims and verify each one. Cost grows linearly with the number of claims and reaches thousands of LLM calls per topic.
We want a method that is model-agnostic, label-free, hyperparameter-free, and cheap, and that still tracks factuality.
Semantic Isotropy
The rest of this section builds the semantic isotropy score used to predict nonfactuality in long-form text in three short steps. First, we recall the standard definition of isotropy for a set of unit vectors and apply it to a set of response embeddings. This gives a clean geometric picture, but it only tells us whether a set is exactly isotropic or not. Second, we replace that yes/no condition with a continuous level of isotropy by taking the von Neumann entropy of the cosine kernel. Third, we rescale that quantity to lie in \([0, 1]\) and read it as a trust score: tight clusters of embeddings indicate agreement and factuality, while uniform dispersion indicates disagreement and likely hallucination.
From Isotropy to Semantic Isotropy
Start with the textbook definition. Unit vectors \(x_1, \ldots, x_N \in \mathbb{R}^D\) stacked as columns of \(X\) are isotropic when
\[X^\top X = I_N .\]Geometrically, they spread uniformly across the sphere with no preferred direction.
Now replace each \(x_i\) with the normalized embedding \(\bar e_i\) of a long-form response \(r_i\). Given a prompt \(p\), sample responses \(\mathcal R = \{r_1, \ldots, r_N\}\), embed each through any model \(\Gamma_\theta\), and normalize:
\[e_i = \Gamma_\theta(r_i), \qquad \bar e_i = e_i / \lVert e_i \rVert .\]The cosine kernel matrix is \(K_E^{\cos} = \bar E \bar E^\top \in \mathbb{R}^{N\times N}\), with entries \([K_E^{\cos}]_{ij} = \bar e_i^\top \bar e_j\).
The intuition is direct. A prompt with a single well-grounded answer pulls independently sampled responses together in embedding space; the kernel stays far from the identity. A hallucinating model produces semantic disagreement across samples; the kernel drifts toward the identity.
Measuring the Level of Isotropy
Strict isotropy is binary. A continuous level of isotropy comes from the von Neumann entropy of the trace-normalized cosine kernel:
\[\mathrm{vNE}(K_E^{\cos}) \;=\; -\operatorname{tr}\!\left(\bar K_E^{\cos} \log \bar K_E^{\cos}\right) \;=\; -\sum_{i=1}^{N} \lambda_i \log \lambda_i,\]where \(\bar K_E^{\cos} = K_E^{\cos} / \operatorname{tr}(K_E^{\cos})\) and \(\lambda_i\) are its eigenvalues. The quantity reaches its maximum \(\log N\) for perfectly isotropic embeddings and drops to \(0\) when every embedding is parallel.
The Semantic Isotropy Score
Dividing by \(\log N\) gives the semantic isotropy score
\[\mathcal{I}(K_E^{\cos}) \;=\; \frac{\mathrm{vNE}(K_E^{\cos})}{\log N} \;\in\; [0, 1] .\]The interpretation is the paper’s punchline:
$\mathcal{I} \to 0$ marks tight angular alignment — high agreement, high factuality. $\mathcal{I} \to 1$ marks uniform dispersion — semantic disagreement, likely hallucination.
Three properties make the score practical:
- Computing it requires roughly ten samples and one forward pass through an embedding model. Fine-tuning, labels, and hyperparameters play no role.
- Any embedding model works — open-weight Qwen, Mistral, and Nomic, or closed Cohere, OpenAI, and Gemini — and several perform within noise of each other.
- Alternative matrix functionals (Frobenius norm, inverse trace, log determinant) give similar, slightly worse, results. The signal lives in isotropy itself, not in the choice of functional.
Segment-Score
Benchmarking semantic isotropy demands ground-truth factuality scores for long-form responses. FactScore is the standard, but it decomposes each response into atomic facts and verifies each one independently, which grows expensive for 500–1000 word responses.
We introduce Segment-Score, a leaner alternative:
- Segment the LLM response \(Y(t)\) on topic \(t\) into atomic segments \(\langle s_1, \ldots, s_m\rangle\) with an oracle LLM.
- For each segment \(s_i\), score its veracity in context. The oracle sees the prior segments \(C_i = \langle s_1, \ldots, s_{i-1}\rangle\) and the reference document \(\mathcal{D}(t)\), then returns True or False.
- Return the fraction of True segments, \(\phi(t) = \tfrac{1}{m}\sum_i \mathbf{1}[v_i = \mathrm{True}]\).
Segment-Score uses far fewer oracle calls than FactScore, exploits long-context oracle models, and produces more consistent labels because the oracle judges in context rather than extracting atomic facts. On a 30-entity coherence test against GPT 4.1, Claude 4 Sonnet, and DeepSeek, Segment-Score labels match majority-vote labels 76–91% of the time.
With Segment-Score we built and scored a dataset of 1,182 unique entities and ≈65,450 long-form responses drawn from FactScore-Bio, TriviaQA Entities, and CMU Book Summaries.
Empirical Evaluation
We compare semantic isotropy against Perplexity, LN-Entropy, U.Eign, U.Deg, U.NLI
Main Result
The headline experiment regresses Segment-Score factuality on each uncertainty metric and reports the explained variance \(R^2\). Figure 2 lays out the comparison across the three datasets and the three generators.
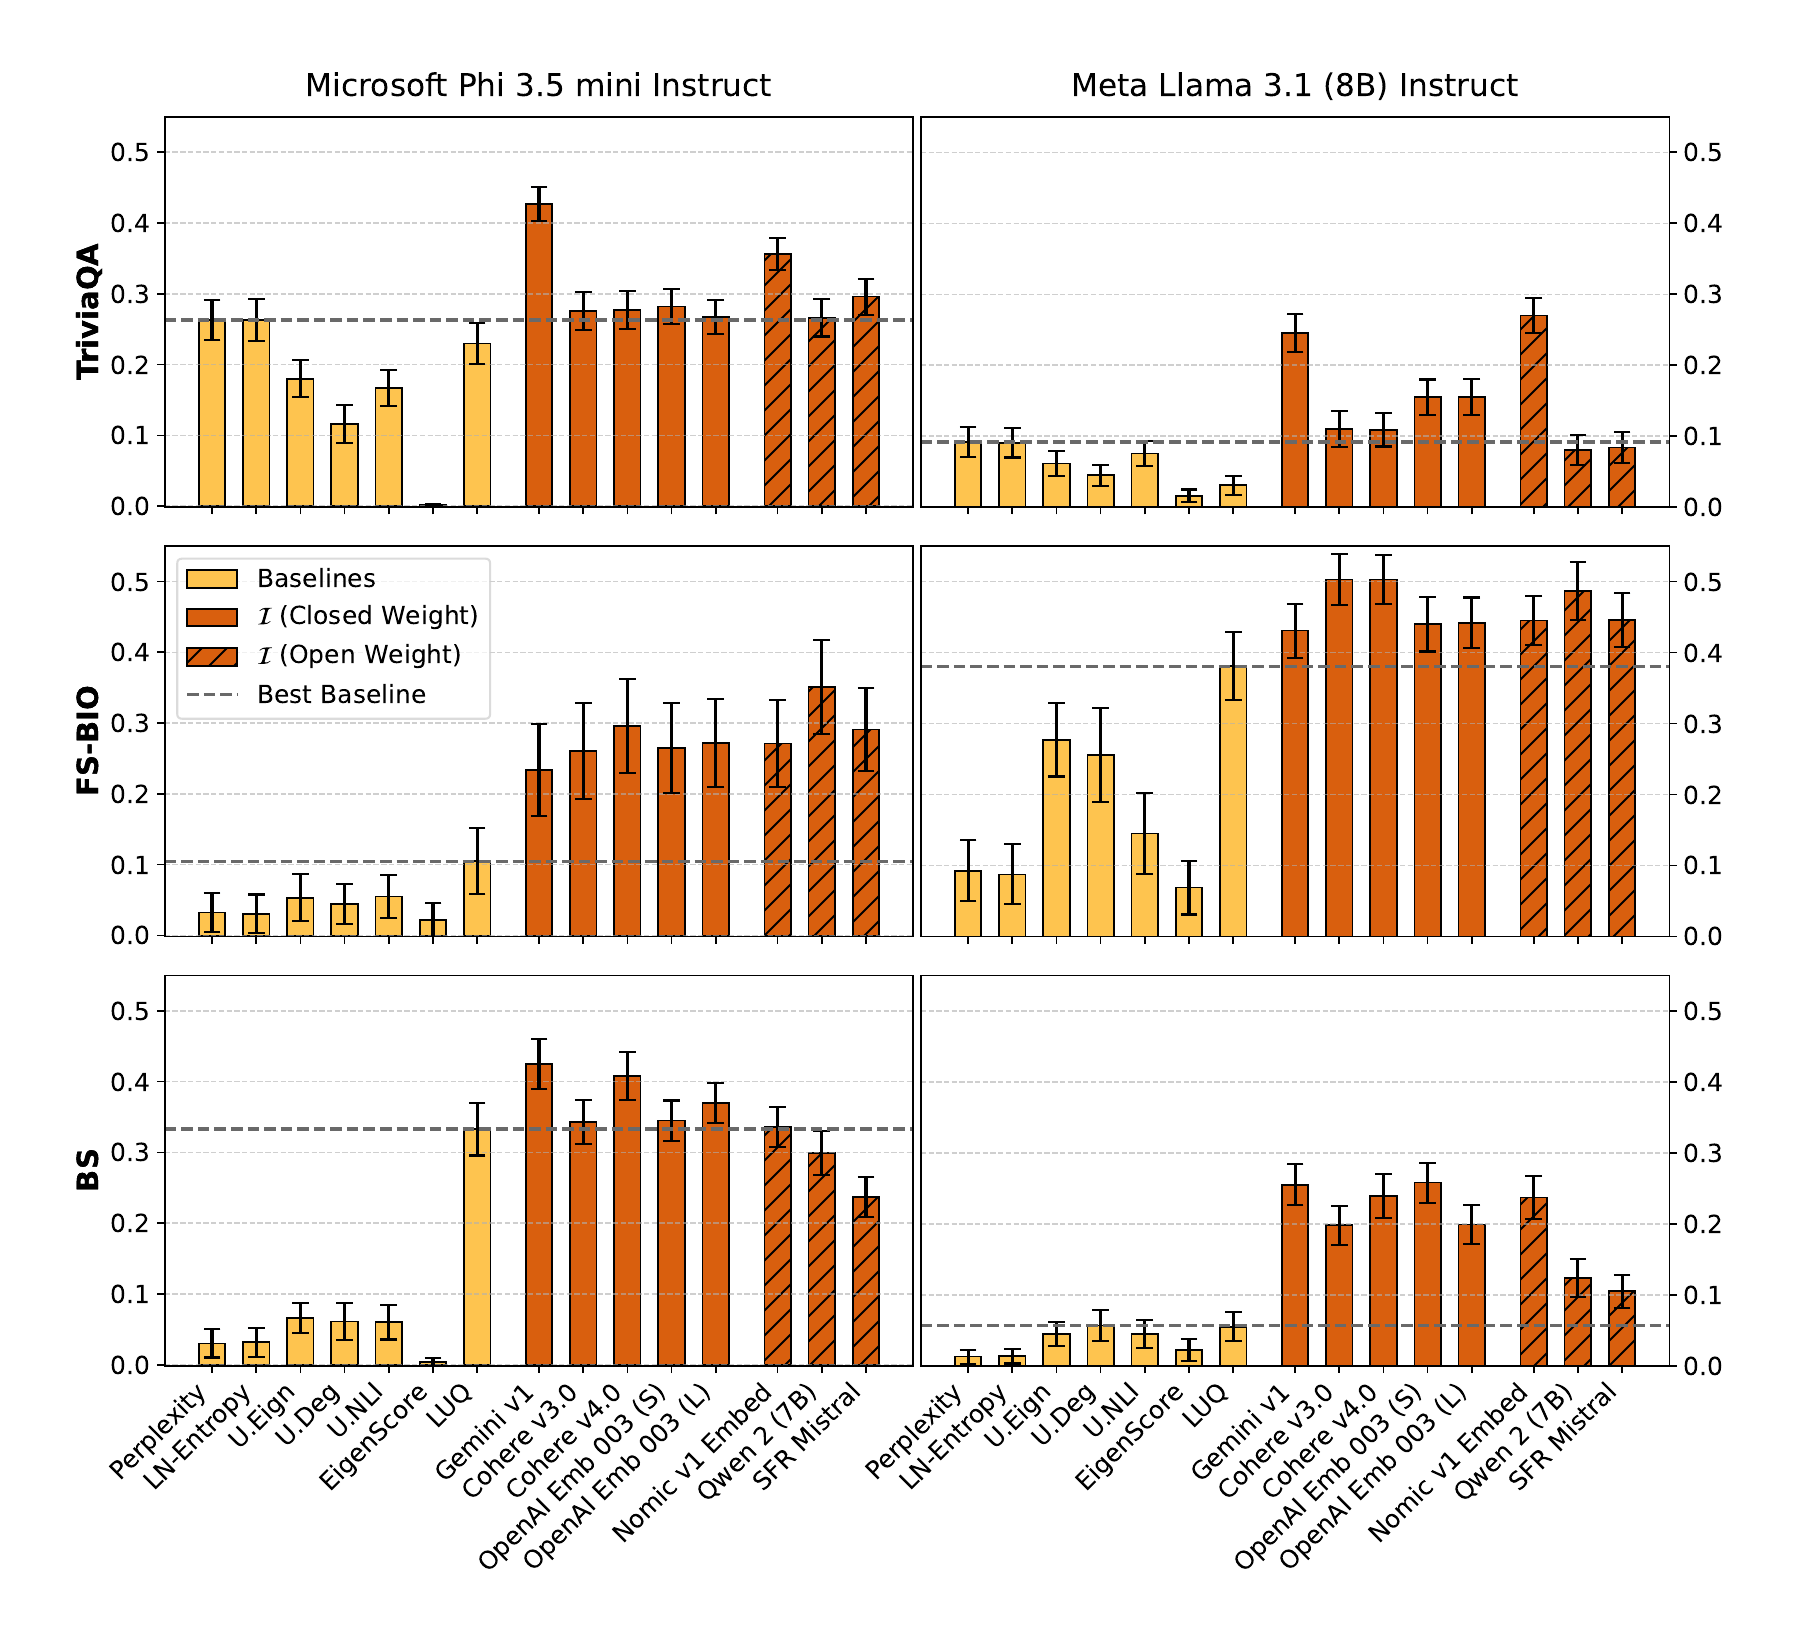
Two patterns dominate. First, every embedding model that instantiates semantic isotropy outperforms every baseline, often by a factor of two to ten in explained variance; even the weakest embedding model beats LUQ-Atomic — the prior state of the art for long-form UQ — on every dataset. Second, the small open-weight Nomic v1 matches and often surpasses the large closed-weight models from Cohere, OpenAI, and Gemini, which suggests that the geometry rewards a good embedding model more than a large one. The pattern repeats across all three generators, so the score is not picking up on a quirk of any single model.
FactScore Cross-Check
A natural worry is that Segment-Score and semantic isotropy share a hidden bias — both, after all, lean on modern LLMs. To rule that out, we re-ran the evaluation under the original FactScore algorithm on FS-BIO. FactScore was developed independently of this work, decomposes responses into atomic facts, and verifies each fact against Wikipedia, so an agreement here is a genuine cross-check.
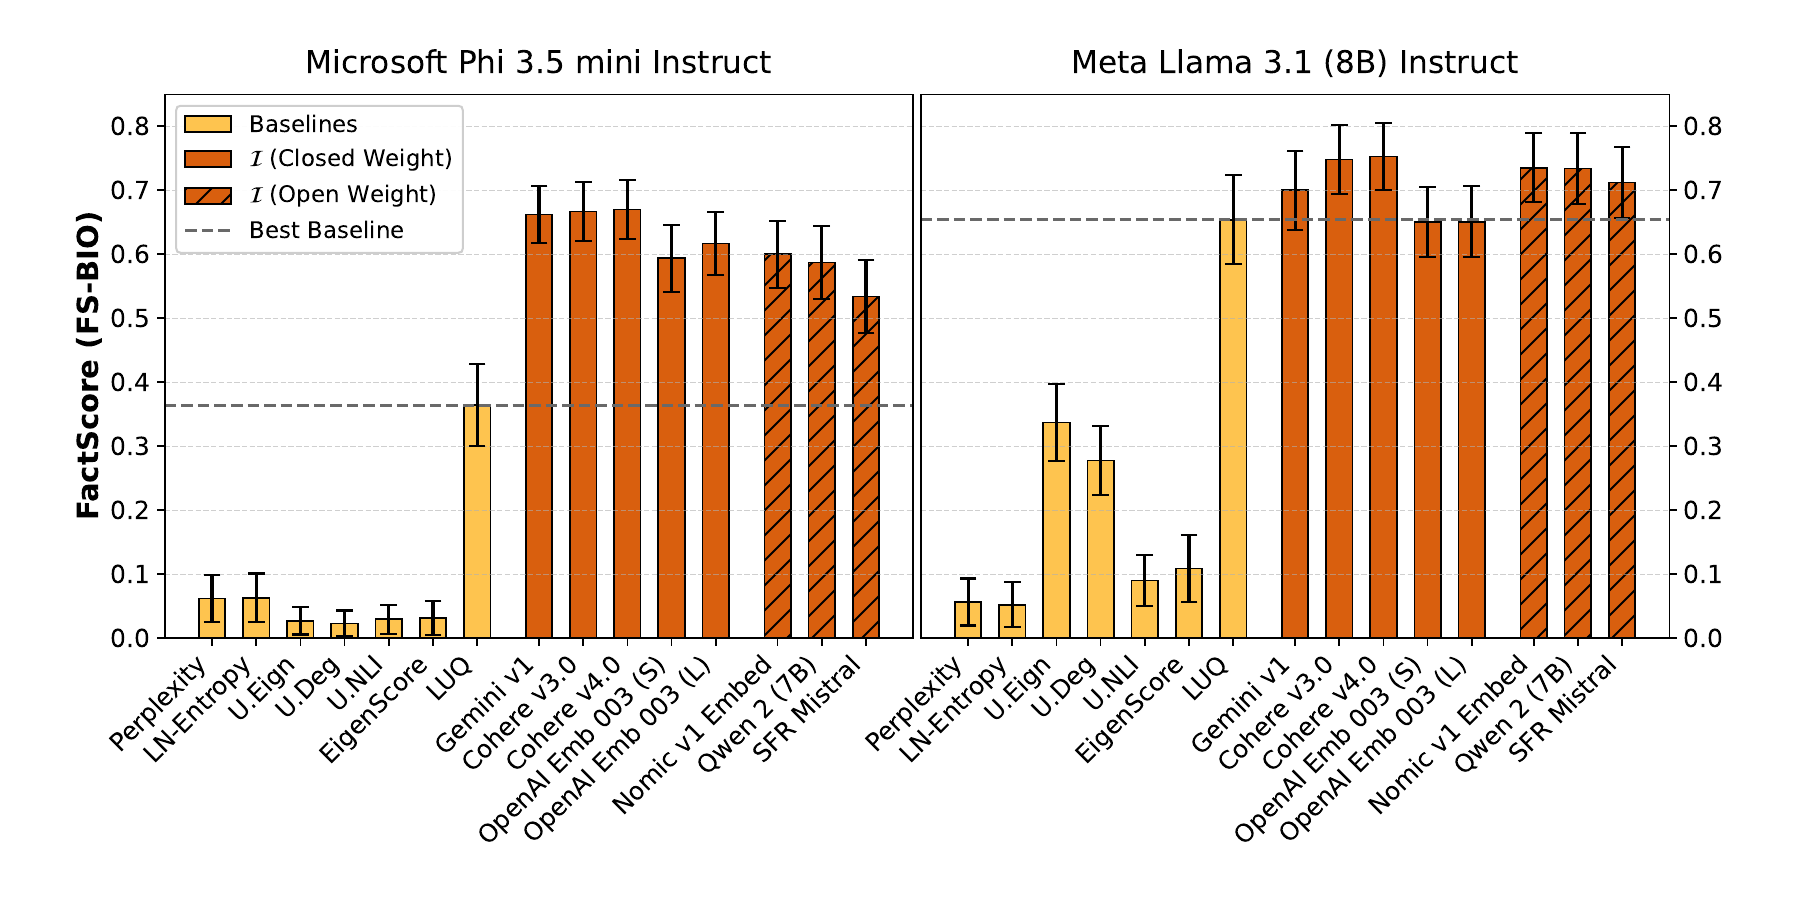
The ranking is unchanged, and the gap to the baselines grows. The result shows that the predictive power of semantic isotropy is a property of the geometry itself, not an artifact of any one factuality scorer.
Sensitivity Studies
A score that only works at one response length, with one embedding model, or with a large sample budget would be of little practical use. We probed the three axes most likely to matter when someone tries to deploy the method.
Does Performance Hold Up on Longer Responses?
Long-form factuality scoring is supposed to handle long responses, so the first question is whether performance degrades with text length. We sweep response lengths from roughly 125 to 1000 words, generated by truncating a 1000-word TriviaQA corpus at sentence boundaries.
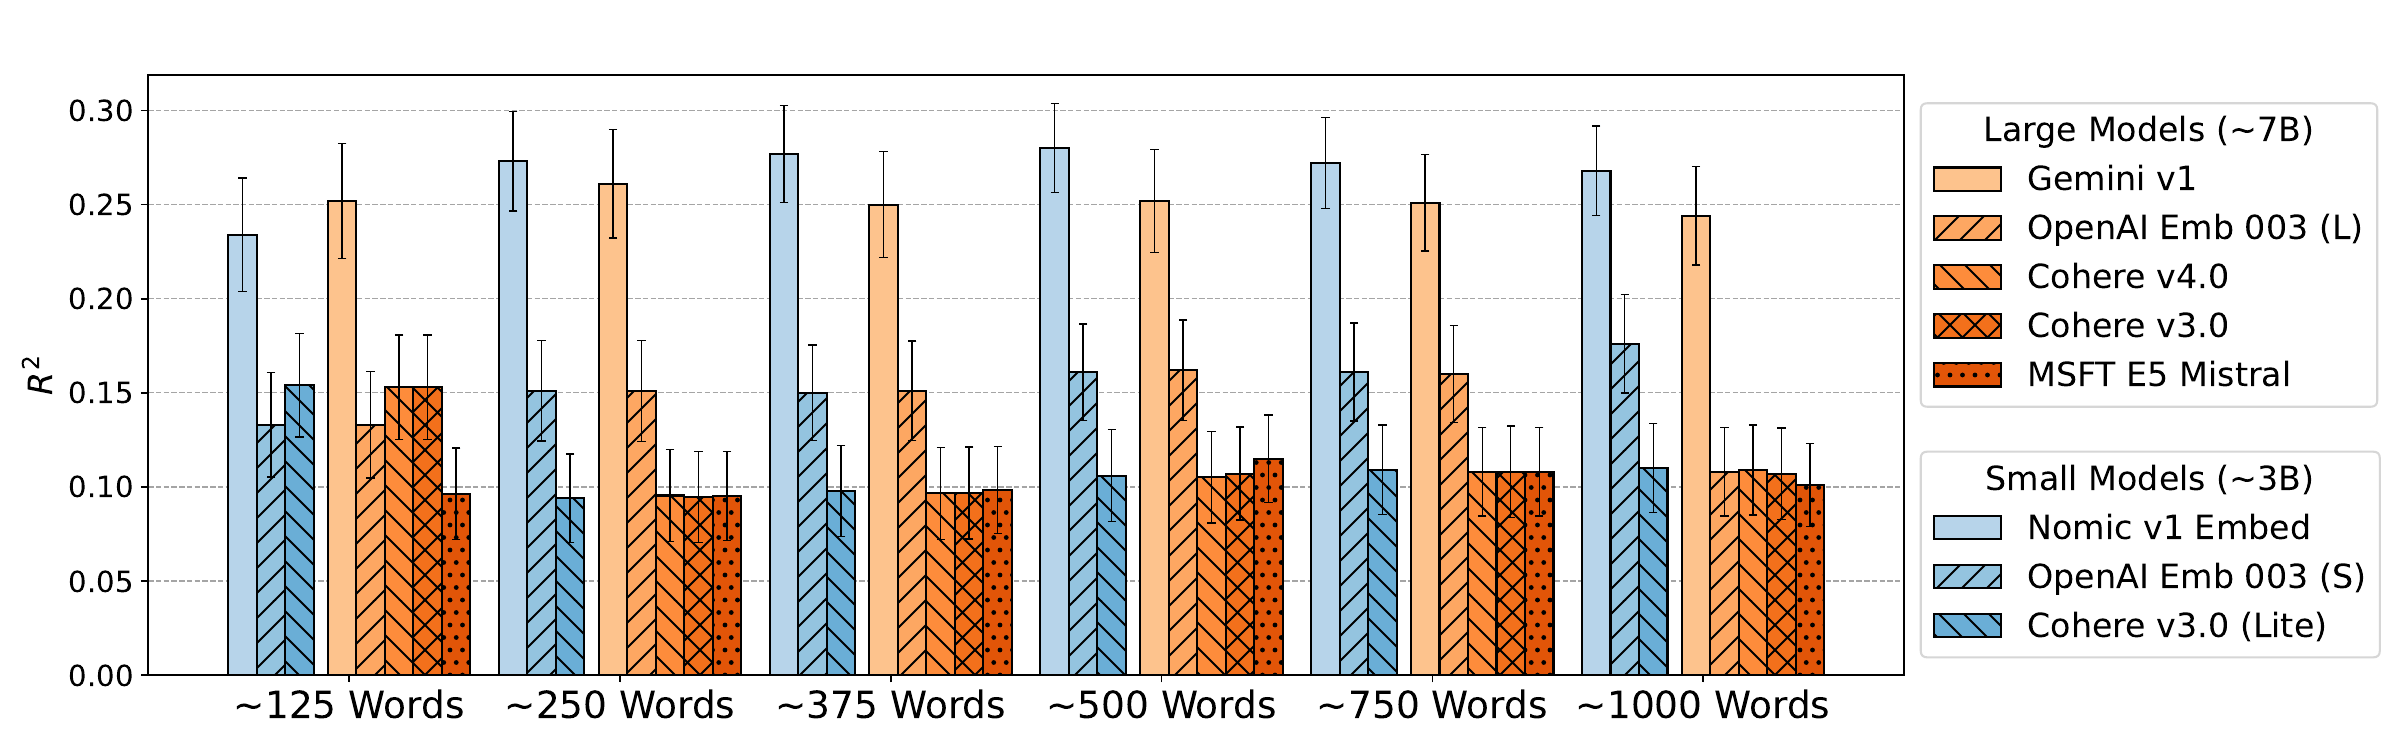
Performance is essentially flat across the range for most embedding models, and OpenAI’s Text Embedding 3 actually improves with response length. The score does not degrade as the text grows — the regime where claim-by-claim methods grow most expensive.
Does the Choice of Embedding Model Matter?
The score should not depend sensitively on which embedding model a practitioner has on hand. Figure 5 (left) plots the gain in \(R^2\) of semantic isotropy over LUQ-Atomic for each embedding model on each dataset.
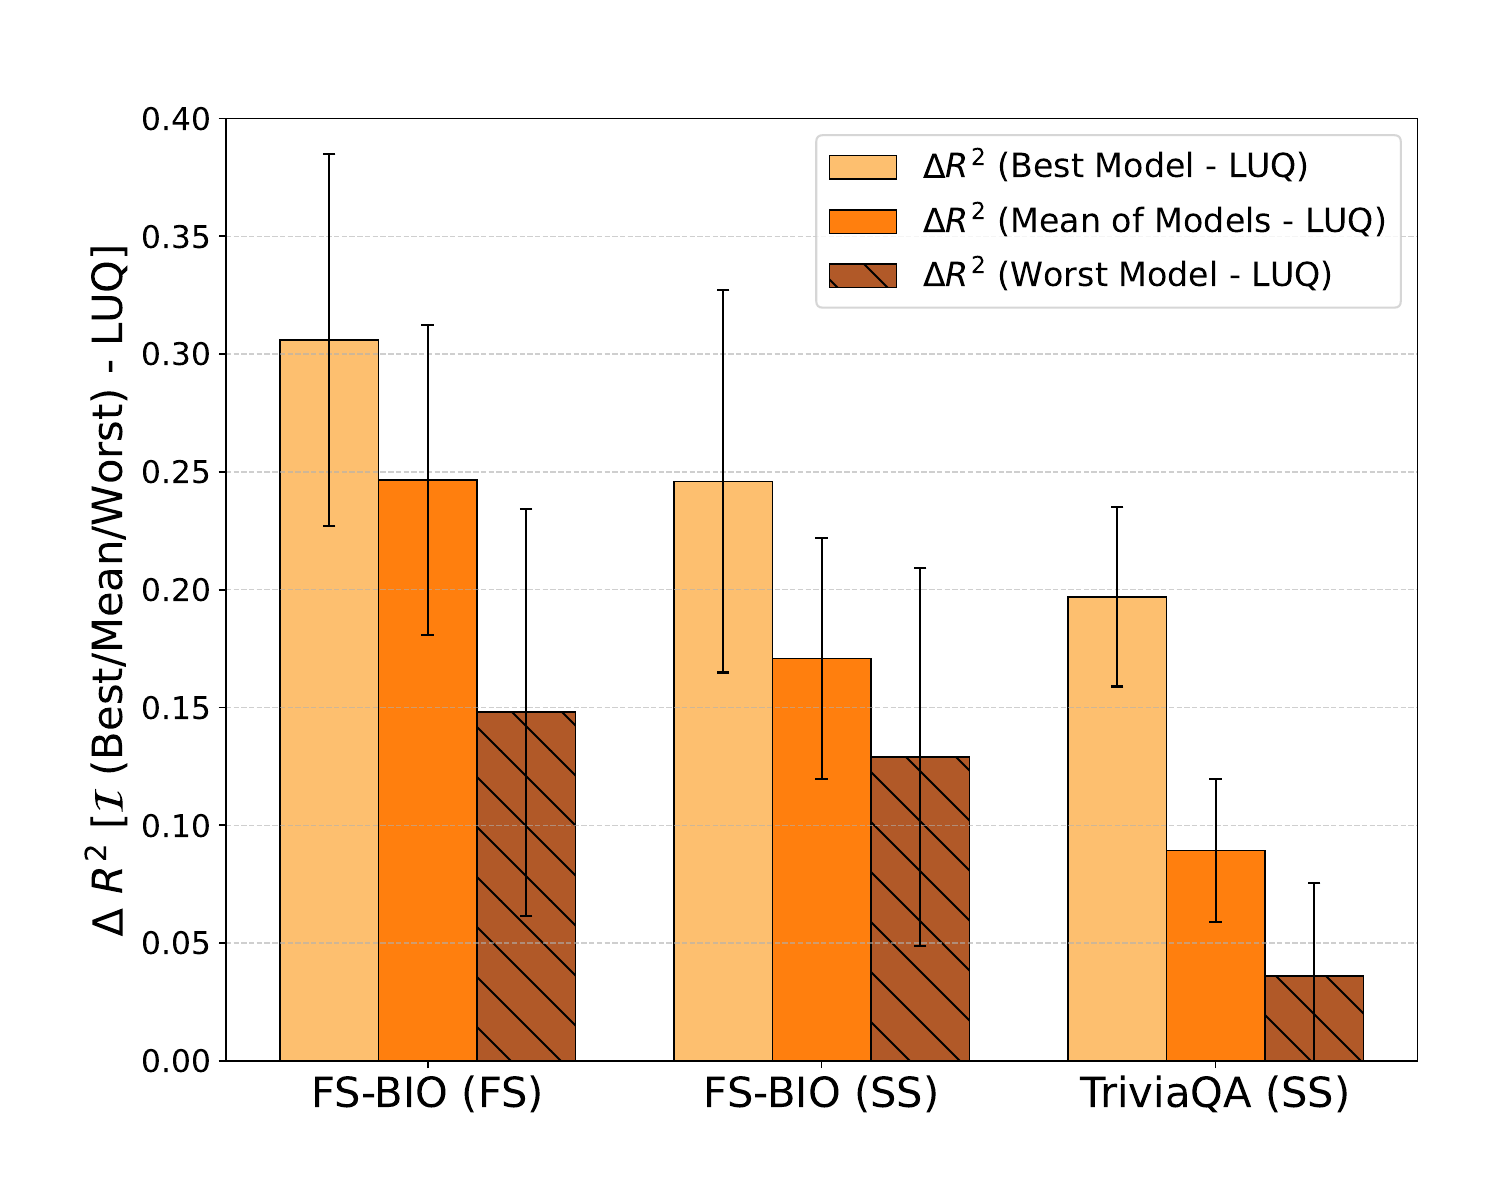
Every bar is positive. The worst embedding choice still beats LUQ-Atomic, and the differences between small and large variants of closed-weight models (OpenAI small vs. large, Cohere v3 vs. v3 Lite) are within sampling noise. Picking the strongest available embedding model helps, but no choice is disqualifying.
How Many Samples Do You Need?
The cost of the method scales with the number of sampled responses \(N\), since each requires a generator call and an embedding call. Figure 6 shows how \(R^2\) rises with \(N\) on FS-BIO.
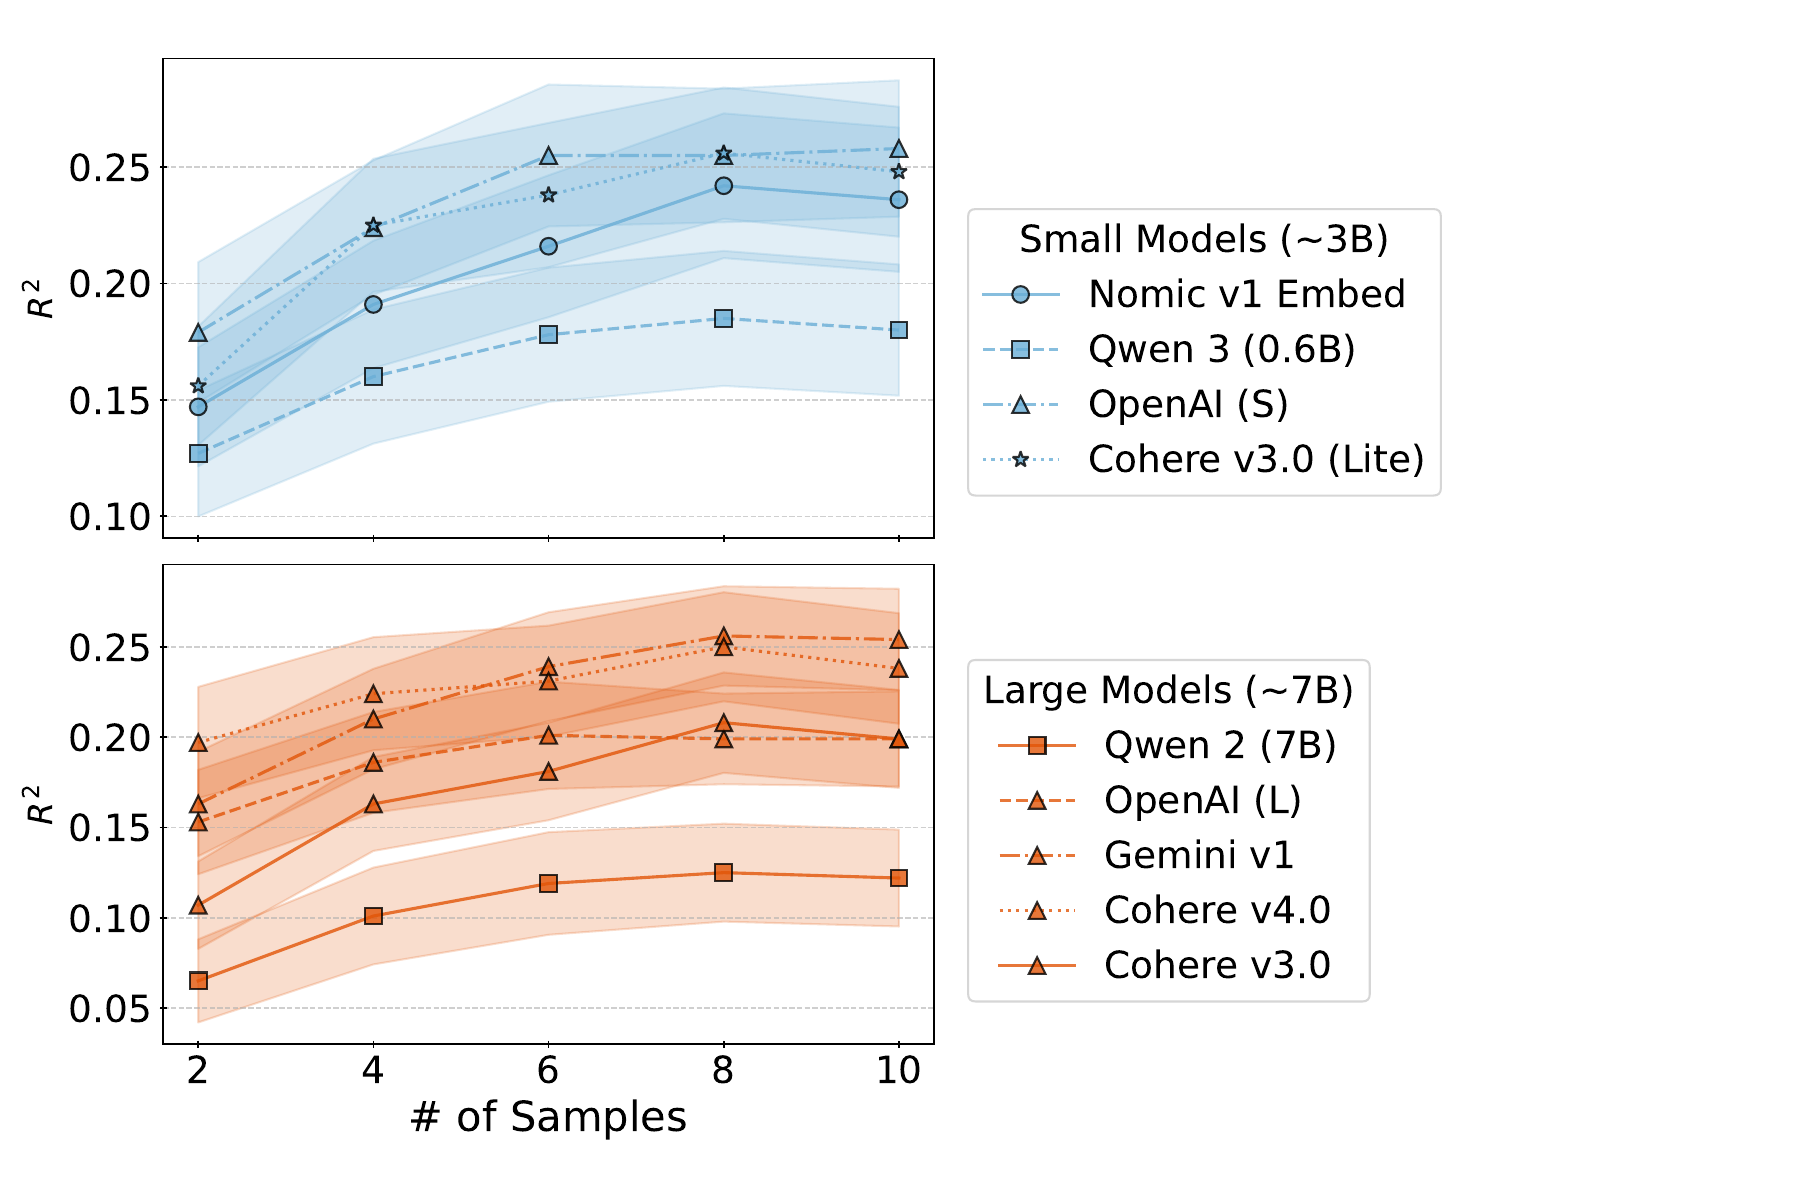
Performance climbs steeply for the first few samples and flattens by \(N \approx 10\). Doubling the sample budget beyond that yields diminishing returns, which puts the method squarely in the range that is cheap to run at scale.
Taken together, the three studies show that the qualitative picture survives every perturbation we tried: choice of embedding model, choice of isotropy functional (von Neumann entropy, Frobenius norm, inverse trace, log determinant), response length, and number of samples. Semantic isotropy is a robust, cheap, model-agnostic predictor of nonfactuality.
Takeaways
- A simple geometric quantity — the von Neumann entropy of the cosine kernel of normalized response embeddings — predicts nonfactuality in long-form LLM generations better than much more complex baselines.
- Ten samples and an off-the-shelf embedding model suffice. No labels, no fine-tuning, no hyperparameter selection, no claim extraction.
- Isotropy itself carries the signal. Robustness across embedding models and matrix functionals is the most encouraging finding.
- Segment-Score offers a practical, scalable alternative to FactScore. We release ≈65k Segment-Score-annotated responses to support further research.
Code and Paper
If you use semantic isotropy or Segment-Score in your work, please cite:
@inproceedings{bhardwaj2026isotropy,
  title = {Embedding Trust: Semantic Isotropy Predicts Nonfactuality in Long-Form Text Generation},
  author = {Bhardwaj, Dhrupad and Kempe, Julia and Rudner, Tim G. J.},
  booktitle = {Proceedings of the 43th International Conference on Machine Learning},
  year = {2026},
  series = {Proceedings of Machine Learning Research},
  publisher = {PMLR},
}